STANLEY/STELLA 2025
DS OWNER
CARMEUSE 2021 - 2023
DS CONSULTANT
DEMATIC 2020
UI DESIGNER

UX for self-driving forklifts

Improved navigation and troubleshooting. Increased trust in automation.

UX LEAD

PREVIOUS
NEXT

Introduction

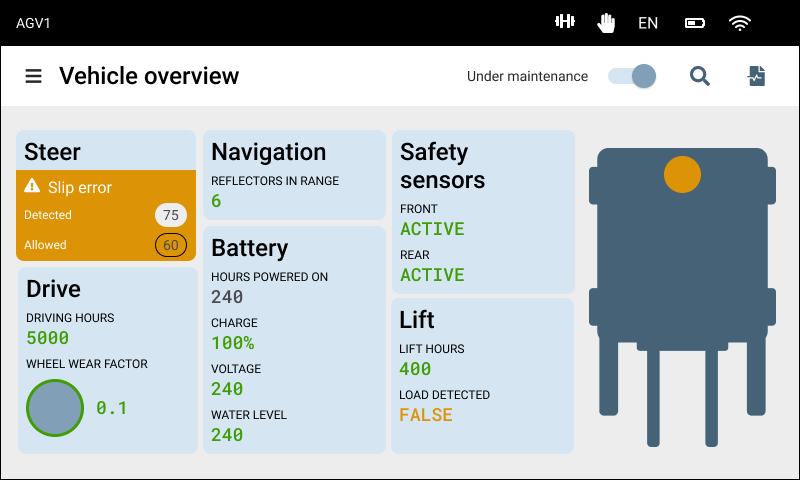
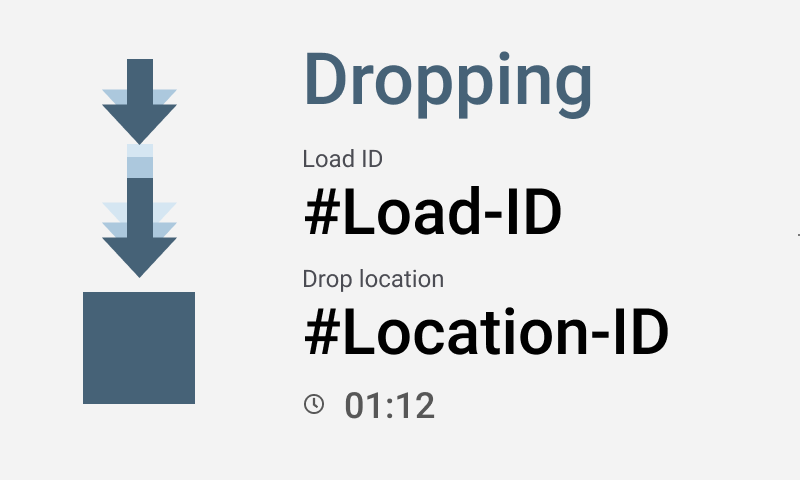
Dematic is  a major player in automated vehicles (AGV’s) such as forklifts. They asked us to work on the conceptual design of the on-board controller: an application accessible through a touch screen on the vehicle, used to provide information about its status and enable its calibration.

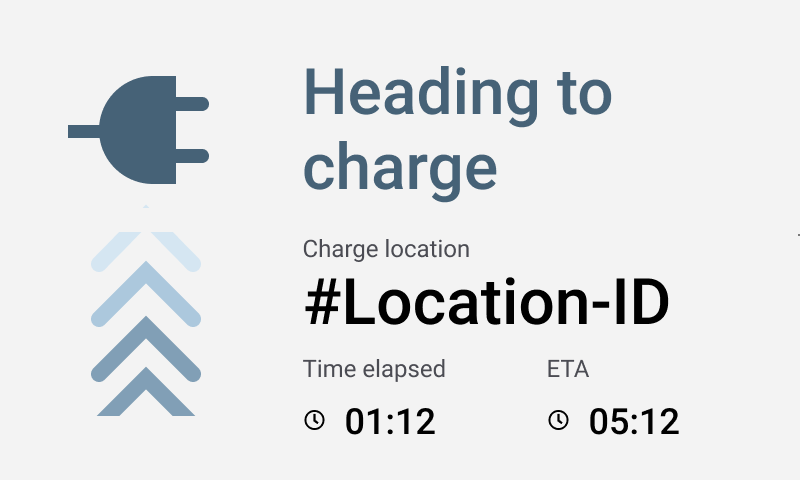
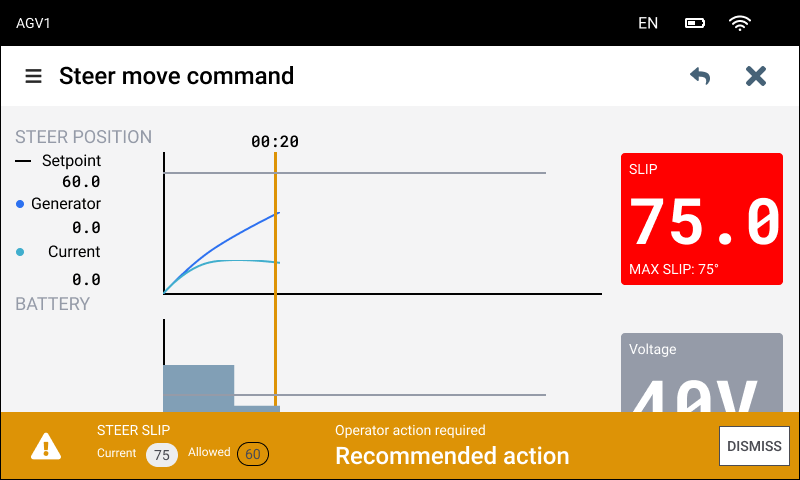
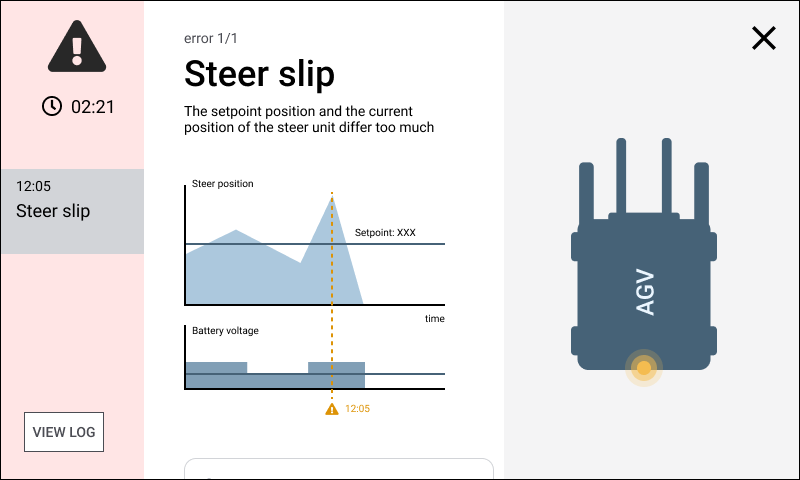
This application is very different from a typical app. In  best case scenario, the user should not interact with the application at all. In worst case scenario, the users must notice that something is going wrong from a distance and easily receive troubleshooting guidance.

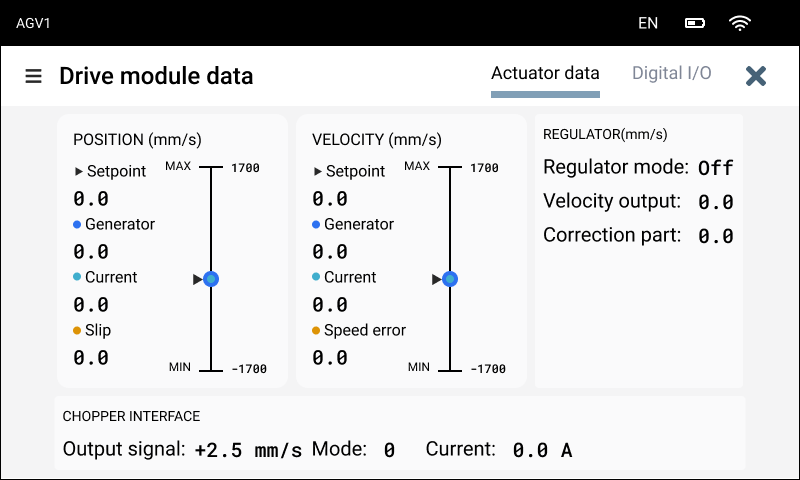
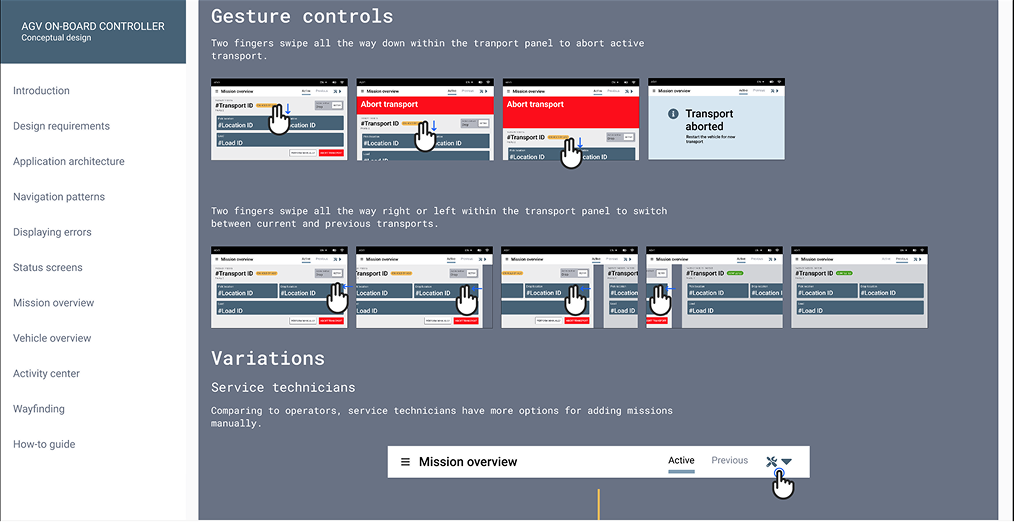
The interaction paradigm is very different from the perspective of service and maintenance. Users rely on it a lot and need to be able to navigate to and calibrate a lot of different parameters.

Key responsibilities

Concept

  • A new type of screens, meant to provide situation awareness from a distance while the vehicles are moving, thus raising worker’s confidence in automation. People will be able to understand  why the vehicles are moving and where are going at a glance.
  • Overhauled the information architecture of the application. We separated completely the information related to the vehicle task (received through the back-end system) and the information related to the vehicle state generated from sensors, actuators and other vehicle hardware.
  • In the previous application, parameters were organised per type (e.g. all the boolean parameters together). We reorganised these parameters based on the hardware component they are related to, better matching the vehicle mental model of the users who perform maintenance.
  • We used analog displays for numeric values, making them more visible when the vehicle is moving, as calibration tasks usually include walking next to the vehicle and monitoring the progression of values on the screen.
  • We introduced trends and other data visualisation patterns for error diagnosing and we embedded troubleshooting guides currently found only on paper.
Vehicle overview dashboard showing slip error in steering, navigation reflectors in range, battery status with 100% charge, active safety sensors front and rear, 5000 drive hours, minimal wheel wear, and 400 lift hours with no load detected.
Interface showing electric plug icon, heading 'Heading to charge', charge location labeled '#Location-ID', time elapsed 01:12, and ETA 05:12.
Drive module data screen showing position and velocity in mm/s with setpoint, generator, current, slip, and speed error values all at zero; regulator data off with zero velocity output and correction; output signal at +2.5 mm/s, mode 0, and current 0.0 A.
AGV1 control screen showing steer move command with setpoint at 60, slip warning at 75 degrees, and a recommended operator action to address steer slip.
Interface showing 'Steer slip' error with warning icon, timer at 02:21, graphs of steer position and battery voltage over time, and a top-down view graphic of an AGV with an alert indicator.
Illustration showing two downward arrows above a dark square with text 'Dropping', 'Load ID #Load-ID', 'Drop location #Location-ID', and a clock icon with '01:12'.

Documentation

As our project sponsors had to present our work to various stakeholders after the end of the project, one of our final deliverables was a Figma prototype documenting the entire concept.

Screenshot from documentation prototype
PREVIOUS
NEXT